
The "ease of use" of vaccines: a simulation study of factors impacting the efficiency of the organizational models of vaccination centers.
Massimo Maurici1, Luca Paulon1
1Department of Biomedicine and Prevention, University of Rome Tor Vergata
Introduction
With regard to ease-of-use in a vaccination contexts, the World Health Organisation (WHO) calls attention to the fact that “In some situations the time required to prepare a vaccine is critical, such as during campaigns with long lines of waiting clients or during outreach activities. For these situations a vaccine product that is easier to use and takes less time to prepare can be extremely valuable and can help to increase coverage” and also that “... Immunisation programmes may also decide to select products that are similar to those already in use to minimise the burden on health care workers”.1
Efficiency and management of vaccination is particularly relevant in low-resources settings. For example, regarding meningococcal vaccination, a vaccination point of dispensing (POD) could be called on to reach a coverage target in a short span of time (e.g two-three weeks).2 This target could be reached, for instance, in a organisational setting in which only a single specific vaccine (such as during an epidemic vaccination campaign) is offered. Another example would be Italian national immunisation plans which could mandatorily require vaccine coverage for meningococcal vaccination >95% within 20193 without allocating more resources and possibly even reducing current resources.
Given that the ease-of-use of a vaccine could be crucial for its impact on the immunisation programme and resources-saving,1 the problem of quantifying its benefits for a vaccination POD in different scenarios, i.e. target population and specific organisational setting.
Since this problem requires a specific in-depth analysis, it is clear that solving such a thorny topic with the simple tools currently available, or with a common sense approach, would be very difficult. We have therefore resorted to a “simulation optimisation approach”.4-7
The case study
We focused the study on two kinds of vaccination PODs, dispensing only meningococcal vaccination.
The first, i.e., the ideal vaccination POD, is organised according to recommendations of the WHO2,8 with one “vaccination team” (i.e., one supervisor, two nurses, three-four record clerks, two-three local community representatives, one technician responsible for the cold chain, and one driver) supported by fundamental logistics, and having a daily goal of 1000 vaccinations (about 300 per working shift).
The second, i.e., the real world vaccination POD, is a limited version of the ideal POD (but closer to a common setting of a vaccination center) in terms of available operators: one supervisor and one security officer are allocated, while nurses (two or three, the exact number to be investigated in the following simulation experiments) have to perform all activities reserved to record clerks, community representatives and technicians which are not available as in the ideal vaccination POD. Such a real world POD organisational model is based upon observations in a real world vaccination setting.
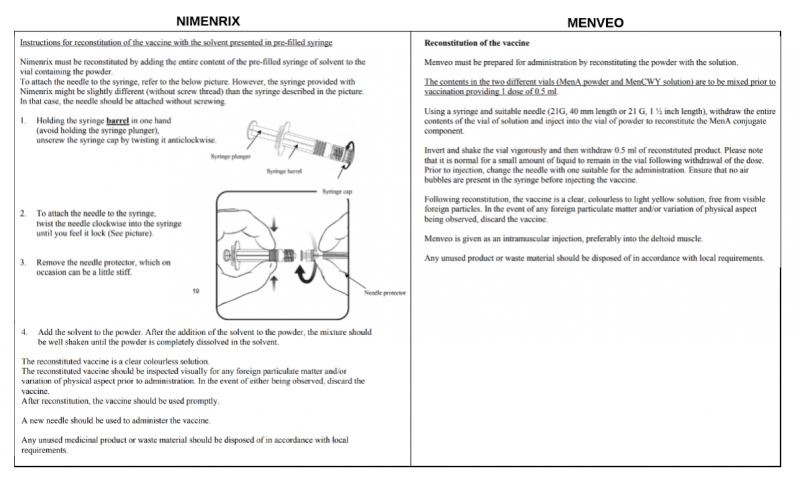
In particular, we measured the efficiency impact of the ease-of-use of specific meningococcal vaccines,1 namely Nimenrix®9 and Menveo®,10 which are available on the market and which can be both used in vaccination PODs in Italy. This because such vaccines are quite different in terms of reconstitution phase as stated in their technical fact sheet (see Figure 111,12).
Figure 1. Nimenrix vs Menveo reconstitution. Details are extracted from the leaflets published by the European Medicine Agency website.
This study aims to specifically answer the following questions:
- Given the use of Nimenrix® or Menveo® vaccine, is the vaccination POD under study able to provide up to 300 doses per shift (i.e., to reach the WHO goal)?
In Italy, the focus on meningococcal vaccination is also motivated by the recent epidemics in Tuscany13 and the recently approved national immunisation plan of the Ministry of Health “Piano Nazionale Prevenzione Vaccinale”14 which mandatorily extends coverage of meningococcal vaccination to 12-18 year old cohort. Increasing vaccine coverage to above 95% in 2019 is also an important goal for public health professionals and regulatory agencies in Italy.3
More in general, according to WHO “Meningitis remains a universal public health challenge in countries around the world - cases and outbreaks are highly dreaded. The global number of deaths due to meningitis was estimated at 380,000 annually. Meningitis is an epidemic-prone disease, and as such deserves special attention given the potentially major impact on health systems, the economy and society as a whole due to the disruptive nature of meningitis outbreaks which are costly and challenging to control”.15
Materials and Methods
The study adopts a quantitative research methodology supported by a simulation approach.
We identified three main steps for solving the simulation problem.
- Step 1 (feasibility of the simulation) consists of an agile iterative prototyping of the conceptual model and simulator of the vaccination POD. Proofs of concept (POC) of the simulator are implemented by using specialised simulation software in order to define, as fast as possible, the required time and costs for performing as fast as possible;
- Step 2 (implementation) and
- Step 3 (application) of the simulation.
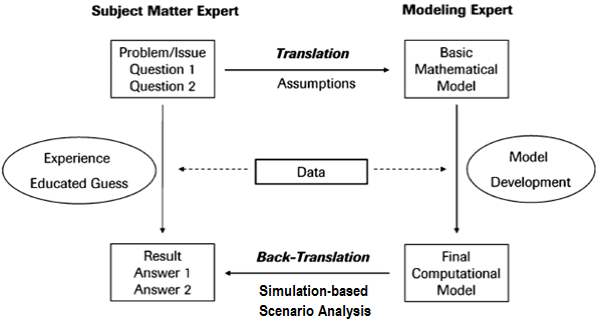
The modelling process requires the collaboration between subject matter experts (e.g., medical doctors) and modeling experts (e.g., mathematical engineers) in order to accurately answer the specific questions under investigation by estimating relevant key performance indicators (KPI) of the vaccination POD (Figure 216 and Figure 317).
Figure 2. Accuracy of results (adaptation from).
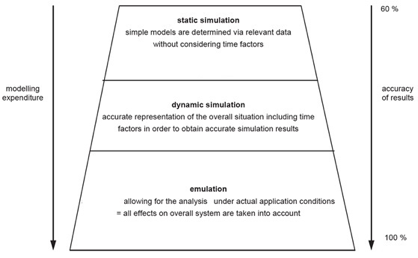
Figure 3. Modeling process (adaptation from).
Conceptual model of the vaccination POD
A top-down method is used to construct the conceptual model of the vaccination POD. Areas and zones of the vaccination POD are identified from WHO guidelines (Figure 4).2,8
Figure 4. Conceptual model of the vaccination POD.

Next, parameters characterising each area and zone both in terms of activities, materials and resources, including relevant parameters assessing the goal under study, are proposed, discussed, chosen and are quantified by the modelers. These decisions are not only based on the simple choices of the modelers but also on various documents (including mandatory parameters such as “daily session duration”) and direct observations.
Some initial assumptions were necessary to better define the model’s needs (see “Notes” in Figure 5).
Figure 5. Relevant parameters defined by the modelers and their ranges.

Simulation model of the vaccination POD
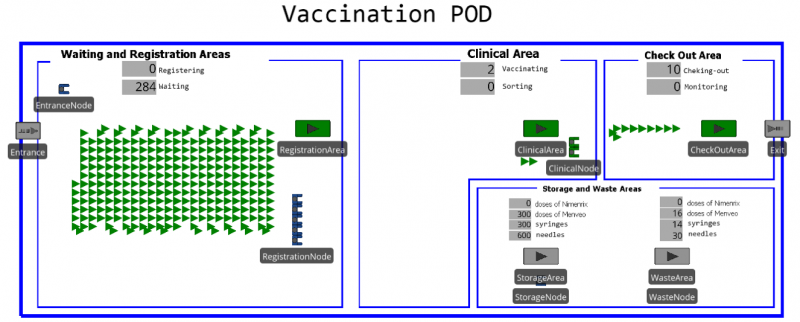
The discrete-event simulation (DES) of the vaccination POD, i.e., the simulator (see Figure 6), is implemented in Simio version 10 (build 168.16501), an integrated development environment for realising general-purpose simulations.18
Figure 6. Simulator of the vaccination POD (at the beginning of simulation). Patients are represented by green triangles. Spatial dimension are neglected assuming rapid movements of people (both patients and operators).
Verification of the simulator (i.e., the process of confirming that the simulation is correctly implemented with respect to the conceptual model) and validation of the simulator (i.e., checking the accuracy of the computational model’s representation of the real system) were performed by comparing their results with the WHO indications, field observation (Figure 7), and results obtained by another independent implementation in R (https://www.r-project.org/).
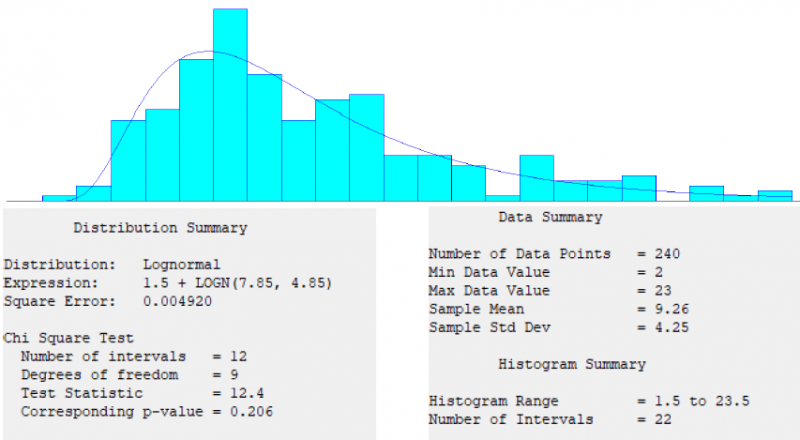
The figure 7 shows the results obtained from several observations in a real vaccination setting. These data (not published), derived from a recent degree thesis (which the authors co-tutored),19 have provided the crucial measure (in terms of KPI) we used to compare data we adopted in simulation model (particularly “in a real world setting”).
Figure 7. Overall registration and vaccination length of time (in minutes) observed during a study in a vaccination POD of the National Health Service in Rome (1-week, February, 2018) during ordinary vaccination sessions (i.e., in a non-epidemic condition).
Simulation Experiments
Given a target population to cover, such a simulator is used to perform several scenario analyses (i.e. experiments for testing different settings and targets), including simulation optimisation of the vaccination session (particularly its duration) and response sensitivity analysis based on linear regression to relate experiment responses (i.e. time to target) to specific input parameters of interest (i.e. vaccine administration time and vaccine reconstitution time).
Fixed parameters (which are the same for all vaccination POD scenarios under investigation in the following) are:
- shift duration (380 minutes);
- session duration (340 minutes, vaccinations starting 10 minutes after the beginning of the shift);
- administration length of time (described by a uniform distribution in the range of 20 and 40 seconds), and
- reconstitution length of time (described by a triangular distribution in the range of 50 and 70 seconds with a 60 median, and a triangular distribution in the range of 69 and 97 seconds with an 83 median, for Nimenrix® and Menveo®, respectively).
“Control variables” (controls), i.e., parameters which change over different scenarios hereafter shown, are:
- the target population per session (300 or 280 people);
- the registration area capacity (three or four for the ideal vaccination POD, and two or three, i.e., equal to the clinical area capacity, for the real world vaccination POD);
- the clinical area capacity (two or three) and
- the adopted meningococcal vaccine (Nimenrix® or Menveo®).
The simulated vaccination team, which differs from ideal and real world PODs, is composed of:
- one supervisor;
- one security officer;
- community representatives in a number equal to the registration area capacity or zero for the ideal and real world vaccination PODs, respectively;
- record clerks in a number equal to the registration area capacity or zero for the ideal and real world vaccination POD, respectively;
- nurses in a number equal to the clinical area capacity;
- technicians in a number equal to one or zero for the ideal and real world vaccination PODs, respectively.
Results
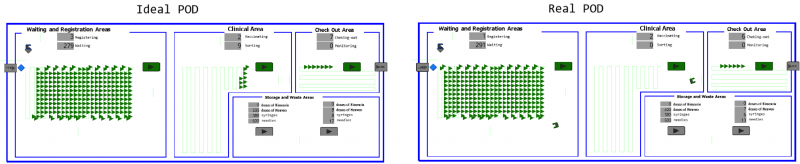
By using two instances of the simulator, the ideal vaccination POD and the real vaccination POD defined in the introduction of the case-study have been tested together (Figure 8).
Figure 8. Ideal vaccination POD (left) and real vaccination POD (right) under investigation at the same time (i.e., per single scenario).
The simulator of the ideal vaccination POD provides the following responses:
- O (output patients) is the number of vaccinated people;
- T2T (time to target) measures the time between the beginning of the vaccination session to when all the target population is covered (0 otherwise);
- FT (free time percentage) measures the ratio between the time remaining at the end of session after the T2T, and the session duration.
In the simulation of the real vaccination POD, the responses O_real, T2T_real and FT_real have the same meaning as O, T2T and FT for the ideal vaccination POD, respectively.
Having fixed exactly the same relevant parameters for both vaccination POD (as described in more in detail in the previous section, e.g., the shift duration to 380 minutes) and by varying the target population per session as control variables, the number of vaccinators (i.e. the clinical area capacity) and the presence or absence of supporting personnel (i.e. the registration capacity which characterises the ideal and real world setting, respectively), there are six analysed vaccination scenarios (Figure 9). Furthermore, due to the randomicity of the parameters vaccine reconstitution and administration length of times, 100 simulation replications per simulation scenario were executed.
Figure 9. Definitive scenario analysis of the Ideal (first three responses columns) and Real (last three responses columns) vaccination POD.

The first two scenarios show that with a clinical area capacity of two units, a target population per session of 300 people, as stated by WHO, cannot be served by using the Menveo® vaccine in real world vaccination POD. Thus, the comparison of two vaccines can only be performed by decreasing the target to 280 people. Having established this target, for the real world vaccination POD the average free time percentage (FT_real) is about 17.54% and 1.73% for Nimenrix® and Menveo® respectively (see Figure 9 at column FT_real, scenarios Nimenrix-Scenario02-280 vs Menveo-Scenario02-280). More specifically, the next two figures (Figure 10 and Figure 11) show SMORE (Simio Measure of Risk & Error) plots including FT_real minimum, maximum, mean, median (with upper and lower percentile) and confidence intervals.
Figure 10. Free time (%) in the real vaccination POD when the target population is 280 people, the number of vaccinators is 2, and the used vaccine is Nimenrix and Menveo, respectively.

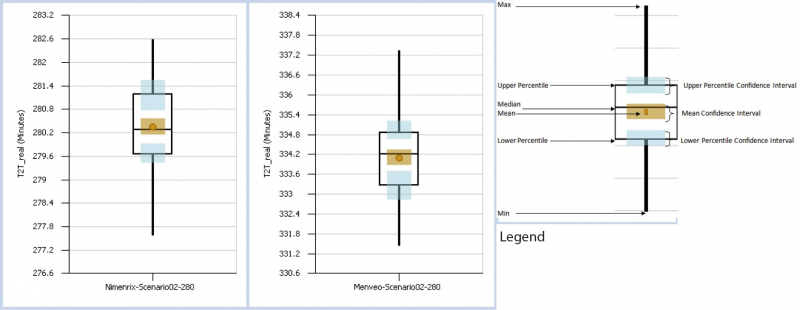
Such free time percentages (shown in Figure 10) correspond to an average time to target (T2T_real) of 280.3 and 334.1 minutes when the vaccine is Nimenrix® and Menveo®, respectively (Figure 11). Thus, the time saving can be simply evaluated by difference with the session duration (340 minutes).
Figure 11. Time to target (minutes) in the real vaccination POD when the target population is 280 people, the number of vaccinators is 2, and the used vaccine is Nimenrix and Menveo, respectively.
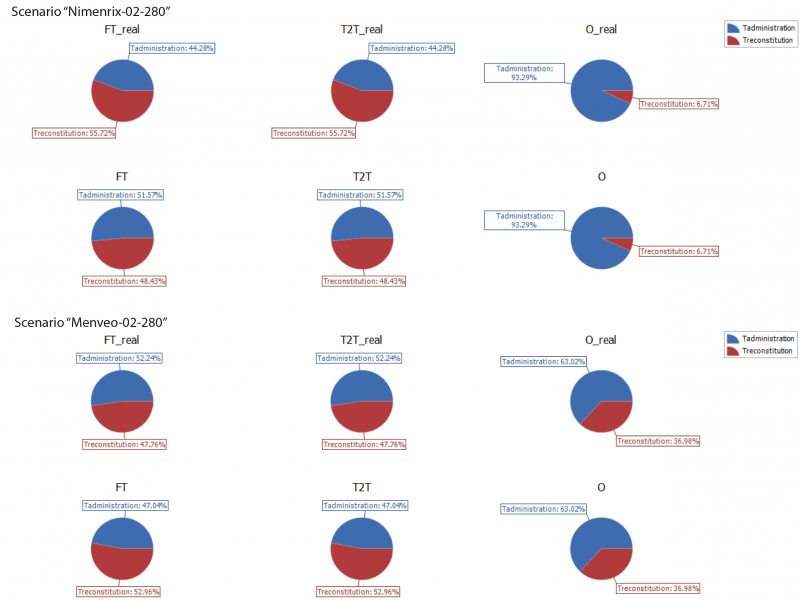
By continuing the focus on the scenarios characterised by a target population of 280 people, the sensitivity analysis shows that the relevance of reconstitution phase for having free time, i.e., the impact of the ease-of-use of the vaccine, is 55.72% and 47.76% when the adopted vaccine is Nimenrix® and Menveo®, respectively. The number of vaccinated users (O_real = 280 people in both cases) is less influenced by the reconstitution of Nimenrix® (6.71%) and more sensitive to the reconstitution of Menveo® (36.98%), while the other impact on the covering of the target population derives from the time spent by the vaccinators in the administration of the vaccine (Figure 12).
Figure 12. Sensitivity analysis. Weights (%) of the vaccine administration time (i.e., Tadministration) and the vaccine reconstitution time (i.e., Treconstitution) on the defined responses (i.e., FT, T2T, O for the ideal vaccination POD, and FT_real, T2T_real, O_real for the real vaccination POD) when the target population is 280 people, the number of vaccinators is 2, and the adopted vaccine is Nimenrix (up) and Menveo (down), respectively.
Results obtained by independent implementation in R (https://www.r-project.org/) showed a good reproducibility of our simulation model, particularly in T2T results (Figure 13).
Figure 13. Results given by the R simulator of the vaccination POD.

In sum, according to the above results, it is possible, with some recommendations, to answer positively to the initial questions of the case study:
- vaccination POD should allocate operators as in the ideal setting (according to WHO), or
- real world vaccination POD with fewer operators than in the ideal situation should use the most ease-of-use vaccine, i.e., Nimenrix®, which has lowest reconstitution time.
Discussion
In this study, as we are interested in measuring the impact of the ease-of-use of two different meningococcal vaccines available on the market in Italy, namely Nimenrix® and Menveo®. We compare simulated performance of ideal POD (with a complete vaccination team according to WHO) and real world POD (with a reduced vaccination team) providing only one type of vaccination to predefined target patients (assumed to be present at the beginning of the vaccination and in good health). By adopting a vaccination session, easy under an organisational point of view, non-clinical activities of the POD can also be optimised at the highest level of efficiency. This could be considered as a limit of the study. However, if this first impression is exceeded, such an organisational model gives to the vaccination POD the ability to operate efficiently, both in emergency situations as well as under normal conditions, also with relevant time and cost savings by leveraging the ease-of-use of the adopted vaccine. The quality of the service can also be improved more easily by engaging patients and health workers in the study of relevant aspects of the single specific vaccination.20-21 Due to lack of usable evidence from literature or observable vaccination POD which operate “under the same condition” hypothesised, the results of the study do not take vaccine reconstitution errors or possible vaccination side effects into consideration.22
In particular, we evaluated the effects of the advantage given by the reduction of the reconstitution time provided by Nimenrix® during a mono vaccination session in a real world vaccination POD. Having a target of 280 people per session (340 minutes), the ability of the clinical area (i.e., vaccinators) to achieve it is less sensible to the reconstitution of Nimenrix® (6.71%) and more sensible to the reconstitution of Menveo® (36.98%), while for the rest it depends on the time spent in the administration of the vaccine. The resulting average free time percentage is about 17.5% (60 minutes) and 1.7% (6 minutes) for Nimenrix® and Menveo®, respectively. The above percentages are critical to understanding and suggest how to reach the right number of vaccinated patient in a short span of time. The differences that emerged from the sensitivity analysis could be taken into consideration and better investigated in order to offer a more efficient service.
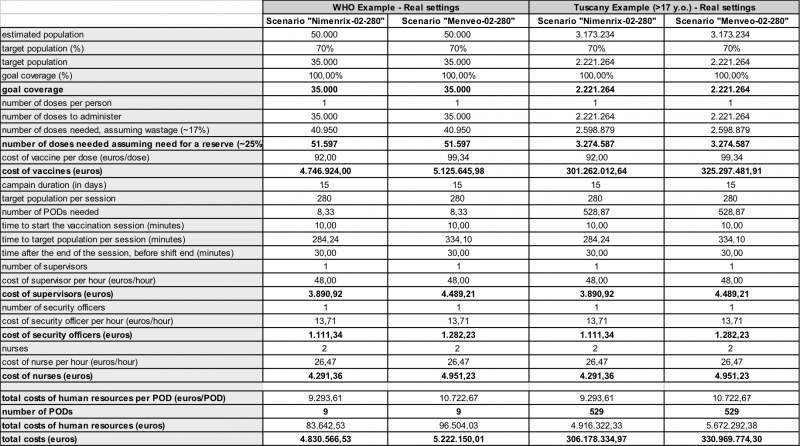
Such a result can be easily applied to obtaining further insights and evaluations (see Figure 14 for some examples of possible economic implications in a real scenario). For example, application to the meningitis epidemics in Tuscany could reveal an overall cost saving of about 24.7 million Euros (including vaccine cost) by using the Nimenrix® vaccine to implement a hypothetical vaccination campaign according to the WHO recommendations.
Figure 14. Examples of economic implications. In case of meningitis epidemic and according to recommendations by the WHO, operators of each involved vaccination POD can be temporary hired to cover the target population within 2 weeks from the start of the vaccination campaign. The free time (if any) could be use to close the POD itself in advance for having a cost saving (assuming operator unitary costs per hour).
Although a vaccination POD which provides only one type of vaccination is not frequently to observe in reality, we underline that such a POD can offer valid organisation to be taken into consideration when there is a specific request to reach a vaccination goal, especially in a low setting resources and in a few days/weeks of vaccine sessions (i.e., not only during outbreaks).
Our simulation results are confirmed by independent implementation of the simulator.
Future research could consider the simulation of specific vaccination centers in Italy and eventually in other countries as well, also considering different kind of vaccines, and the prototyping of simulation-based decision-support software for vaccination POD decision-makers.
Acronyms
DES = discrete-event simulation
FT = free time percentage
KPI = key performance indicators
O= output patients
POC = Proofs of concept
POD = point of dispensing
T2T = time to target
Tadministration = vaccine administration time
Treconstitution = vaccine reconstitution time
WHO= World Health Organisation
Acknowledgments
This publication was supported an unconditional research grant from Pfizer Italia srl.
Reference
- WHO. Principles and Considerations for Adding a Vaccine to a National Immunisation Programme: from Decision to Implementation and Monitoring. April 2014. 2014.
- WHO. Control of Epidemic Meningococcal Disease: WHO Practical Guidelines [Internet]. Geneva: World Health Organization; 1998. Available from: http://apps.who.int/iris/bitstream/10665/64467/1/whoemcbac983.pdf
- Italian Ministry of Health. Aspetti operativi per la piena e uniforme implementazione del nuovo PNPV 2017-2019 e del relativo Calendario vaccinale [Internet]. 2017. Available from: http://www.trovanorme.salute.gov.it/norme/dettaglioAtto?id=58583
- Lucidi S, Maurici M, Paulon L. A Simulation-Based Multiobjective Optimization Approach for Health Care Service Management. IEEE Transactions on [Internet]. 2016; Available from: http://ieeexplore.ieee.org/abstract/document/7498670/
- Caro JJ, Möller J. Advantages and Disadvantages of Discrete-Event Simulation for Health Economic Analyses. Expert Rev Pharmacoecon Outcomes Res. 2016 May 3;16(3):327–9.
- Lee BY, Haidari LA. The Importance of Vaccine Supply Chains to Everyone in the Vaccine World. Vaccine. 2017 Aug 16;35(35 Pt A):4475–9.
- Duijzer LE, van Jaarsveld W, Dekker R. Literature Review: The Vaccine Supply Chain. Eur J Oper Res. 2018 Jul 1;268(1):174–92.
- WHO. Immunization in Practice: A Guide for Health Workers Who Give Vaccines [Internet]. Macmillan Press Ltd.; 1996. Available from: http://apps.who.int/iris/handle/10665/193412
- Croxtall JD, Dhillon S. Meningococcal Quadrivalent (Serogroups A, C, W135 and Y) Tetanus Toxoid Conjugate Vaccine (NimenrixTM). Drugs. 2012 Dec 24;72(18):2407–30.
- Cooper B, DeTora L, Stoddard J. Menveo®: A Novel Quadrivalent Meningococcal CRM197 Conjugate Vaccine against Serogroups A, C, W-135 and Y. Expert Rev Vaccines. 2011 Jan 1;10(1):21–33.
- Nimenrix leaflet [Internet]. European Medicines Agency - Europa EU; Available from: http://www.ema.europa.eu/docs/en_GB/document_library/EPAR_-_Product_Information/human/002226/WC500127663.pdf#page=19
- Menveo leaflet [Internet]. European Medicines Agency - Europa EU; Available from: http://www.ema.europa.eu/docs/en_GB/document_library/EPAR_-_Product_Information/human/001095/WC500090147.pdf#page=36
- Stefanelli P, Miglietta A, Pezzotti P, Fazio C, Neri A, Vacca P, et al. Increased Incidence of Invasive Meningococcal Disease of Serogroup C / Clonal Complex 11, Tuscany, Italy, 2015 to 2016. Euro Surveill [Internet]. 2016;21(12). Available from: http://dx.doi.org/10.2807/1560-7917.ES.2016.21.12.30176
- Signorelli C, Guerra R, Siliquini R, Ricciardi W. Italy’s Response to Vaccine Hesitancy: An Innovative and Cost Effective National Immunization Plan Based on Scientific Evidence. Vaccine. 2017 Jul 24;35(33):4057–9.
- WHO. “Defeating meningitis by 2030” Global Roadmap Consultant [Internet]. 2018. Available from: http://www.who.int/entity/immunization/research/IVR-Meningitis-consultancy_12Mar2018.pdf
- VDI. Applications of Simulation for Automated Guided Vehicle Systems [Internet]. The Association of German Engineers (VDI); 2014. Report No.: VDI 2710. Available from: http://www.vdi.eu/nc/guidelines/vdi_2710_blatt_3-einsatzgebiete_der_simulation_fuer_fahrerlose_transportsysteme_fts_/
- Gieschke R, Serafin D. Development of Innovative Drugs via Modeling with MATLAB: A Practical Guide. Springer; 2014.
- Smith JS, Sturrock DT, Kelton WD. Simio and Simulation: Modeling. Analysis, Applications 4th ed Pittsburgh: Simio LLC. 2017.
- Cornia G. Un modello di simulazione a eventi discreti di un centro vaccinale del Sistema Sanitario Nazionale [MSc Thesis]. Roma M Thesis Advisor, Paulon L, Maurici M, Thesis Co-Advisor. Sapienza University of Rome, Italy; 2018.
- Maurici M, Paulon L, Campolongo A, Meleleo C, Carlino C, Giordani A. Quality Measurement and Benchmarking of HPV Vaccination Services a New Approach. Human Vaccines and Immunotherapeutics. 2014, January, 10(1), 2884-2891.
- Maurici M, Paulon L, Carlino C, Campolongo A, Catapano R., Sgricia S., et. al. Measuring and Benchmarking the Quality of Two Different Organizational Ways in Delivering Infant Vaccination. Journal of Preventive Medicine and Hygiene. 2016, 57(2), E75-E80.
- Su JR. Notes from the Field: Administration Error Involving a Meningococcal Conjugate Vaccine - United States, March 1, 2010--September 22, 2015. MMWR Morb Mortal Wkly Rep [Internet]. 2016;65. Available from: https://www.cdc.gov/mmwr/volumes/65/wr/mm6506a4.htm